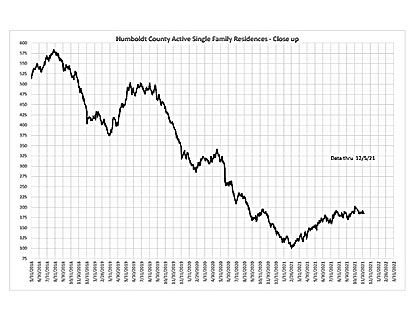
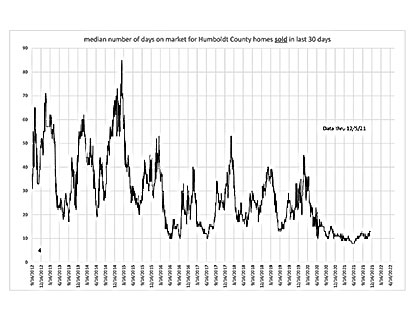
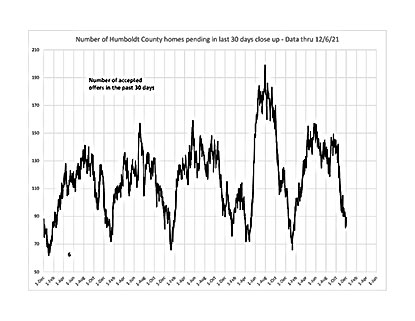
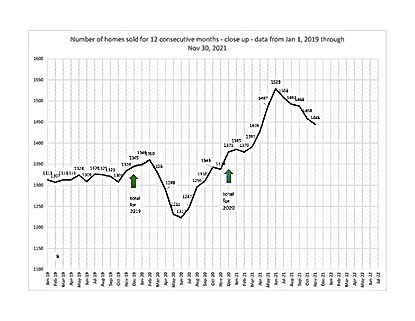
There have been some fun times and crazy times (and frustrating too) lately in Humboldt Real Estate, and it’s hard to visualize exactly what that looks like.
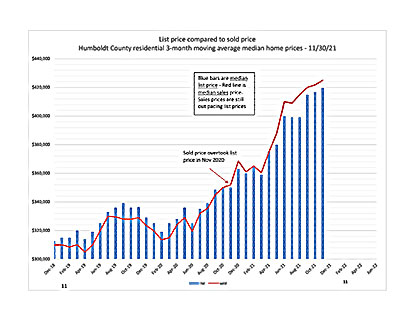
Charles McCann with Community Realty has been creating charts with monthly & annual Real Estate Data and the Charts he creates are pretty amazing. We can now visualize the crazy!
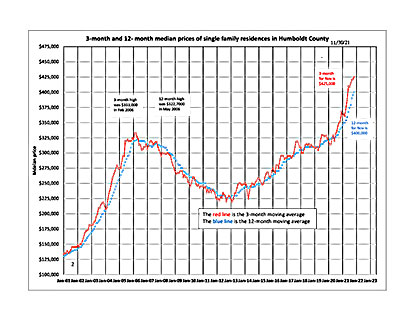
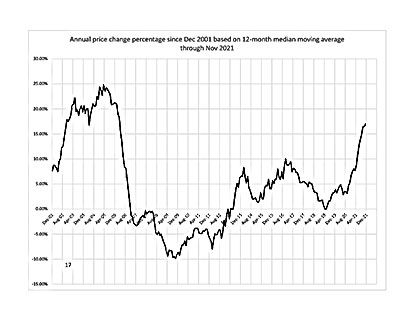
Here are a few Charts to look over, my favorite is the Annual Price Change Percentage since 2001 on a 12-Month Median Moving Average. This chart shows exactly how much the median market price has changed for the previous 12 months, and what a good investment Real Estate has been the last Decade! I wasn’t a realtor in the early 2000’s, so it’s fun to see how the Market shot up.. then waaay down because of the housing bubble.
I confidently feel we are not in a housing bubble because rental prices are soaring, please give me a call to discuss further! The residential housing market may be more aggressive than the Real Estate Sales Market in Humboldt! And lots of people are still projected to move to our area in the coming years!!
Click each image below image to view each as a pdf.
Also a Must-Read from Lostcoast Outpost:
“In fact, the northern Humboldt housing market has moved up that list. Realtor.com, an online real estate listing agency, now has the Eureka-Arcata-Fortuna area third in its October 2021 “Hotness Rank,” deeming it the hottest market in California and the only market in the western United States to crack the top 20.”
https://lostcoastoutpost.com/2021/nov/24/humboldt-housing-market-still-white-hot-eurekas-no/
Until next month!-Dane