Attached are the monthly charts updated through the end of July 2022. The rest are date stamped with the day they were updated. Click each image below image to view each as a pdf.
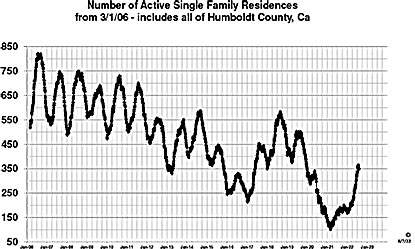
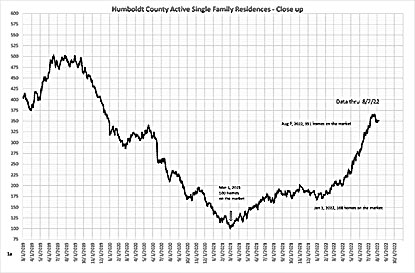
1 and 1a.– Active residences (current inventory) – Inventory continues to rise although at a slower pace than the previous few months. On July 7, 2022 there were 340 homes on the market and on August 7, there were 351. This month, I have added the longer term inventory chart that I keep (started in March of 2006) to give you a perspective of the seasonal ebb and flow of inventory over the years. Since 2019 the swings have not been as pronounced because of the buying pressure but it appears that we may be moving back to our previous seasonal pattern.
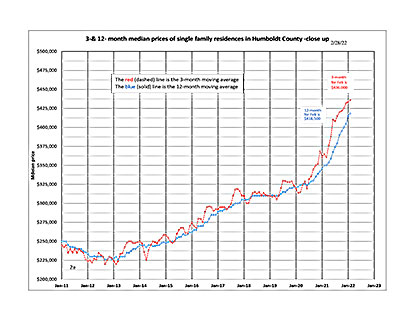
2a. – Median prices. The three month median moving average (red dotted line) reveals the leading edge of market prices. After remaining flat for 3 months at $450,000, the three month median moving average rose to $460,000. I mentioned last month that this pause in price appreciation has happened before but each time the market has started to rise again. Despite falling sales numbers (charts 9 below) upward pressure on prices is still in the market place. The 12-month median moving average also rose in July. Reports are out that on the national scene, prices of homes are trending down. It will take some time to determine if Humboldt will follow that trend or if local market forces cause us to buck that trend.
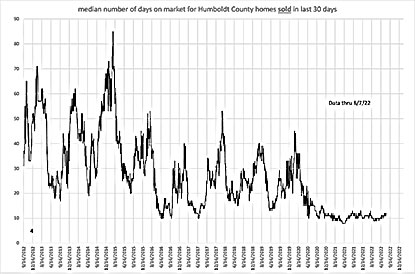
4. – Median DOM (days on market) for homes that sold over the past 30 days. Days on the market hovered between 10 and 12 days for the month of June. (1/2 of the homes were sold in the first 10 to 12 days or less). This is normal for what is considered the latter half of the buying season and shows that there is an active buyer pool still in the market place waiting for their home to come on the market. An added note: for the past two years our “buying season” has been all year long due to various market forces. I do expect our seasonal swings to return typified by the number of days on the market rising in the late fall and winter months.
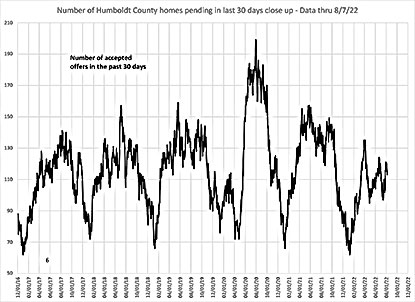
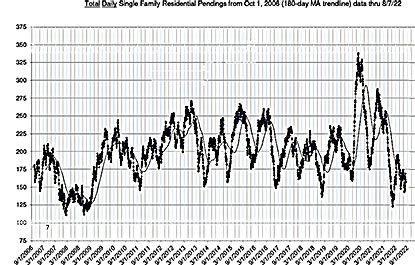
6 and 7. – Number of homes that went pending in the past 30 days/Total pendings. This month I have added a chart that shows the total number of pending homes along with the last 30 days chart. Although the number of days on the market is still low which indicates buying pressure, the number pendings is below normal for this time of year which indicates a smaller buyer pool. On the longer term chart, you can see the dramatic swings in the past two years caused primarily by both the Covid pandemic and the drop and subsequent rise in interest rates. It appears that the market is is transition. Rising inventory, fewer sales yet prices still pushing up. Seems counter intuitive.
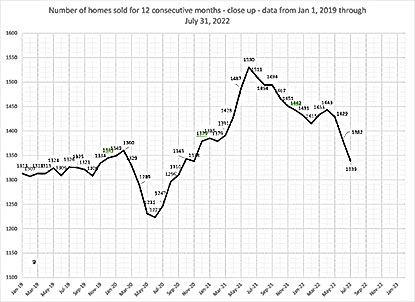
9. – Homes sold for 12 consecutive months. 1530 homes sold in Humboldt County in the 12 month period leading up to June of 2021. A year later, in June of 2022 that number decreased to 1382 and in July, 1339. The trend is still down in the overall number of sales. We are now moving into the end of our buying season and year-end projections of total sales for 2022 are in the 1250 range. That is a faster change than I would have expected and evidence of a market in transition.
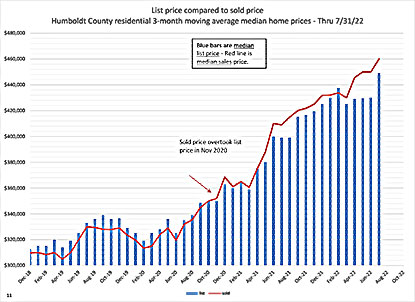
11. – List price compared to sold price. We are still seeing median selling prices above median listing prices. Overbids are still ongoing although the gap closed somewhat in July.