Attached are the recently updated real estate charts. The monthly charts are updated through the end of August 2022. The rest are date stamped with the day they were updated. The charts are selected from a larger list of charts that I keep which is why some numbers are skipped.
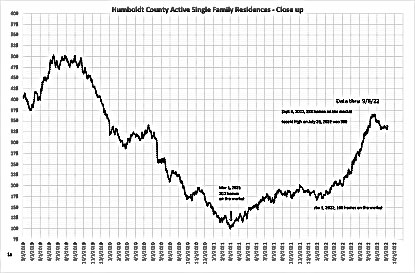
1a.– Active residences (current inventory) – We have trended higher for the year in our inventory of homes but we peaked (so far) on July 23rd with 366 homes on the market. Since then we have declined back to 338. We normally decline into the end of the year but don’t usually start this early in the year. Something worth watching.
Please click each image to view/download full view pdf.
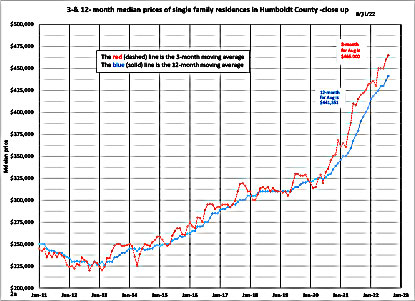
2a. – Median prices. The three month median moving average (red dotted line) reveals the leading edge of market prices. After remaining flat for 3 months at $450,000, the three month median moving average has risen for the past two months to $465,000. Upward pressure on prices is still in the market place. Is Humboldt County bucking the national trend of declining prices? It’s a little too early to tell.
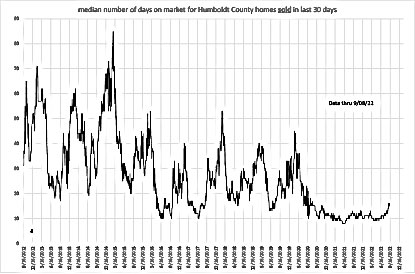
4. – Median DOM (days on market) for homes that sold over the past 30 days. Days on the market has hovered between 9 and 13 days for nearly two years but over the past few weeks we have risen to 16 days. This shows a change in trend and will probably continue to rise as we move into the winter months. It may be that we are now moving back to the more pronounced seasonal swings with less buying pressure as we move into fall and winter. I wrote last month that “I do expect our seasonal swings to return typified by the number of days on the market rising in the late fall and winter months.” Is that coming true? Stay tuned.
6 . – Number of homes that went pending in the past 30 days. The number of homes that are currently pending is less at this time of year compared to most previous years. This continues to indicate fewer buyers in the market place. This number normally declines as we move into Fall and Winter and starts back higher in January. Potentially less activity ahead as we to the end of the year. Winter vacation any one?

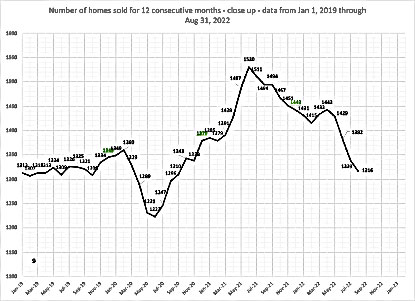
9. – Homes sold for 12 consecutive months. The trend is still down in the overall number of sales with an annualized total for August of 1316. The pool of buyers peaked in the spring of 2021 and has been slowly shrinking since then. It will probably continue to decline into the end of the year before turning back up. In June of 2021 our monthly average of homes sold was approximately 128. This month (August) the monthly average has decreased to 110. We have had fewer sales but prices continue to rise.
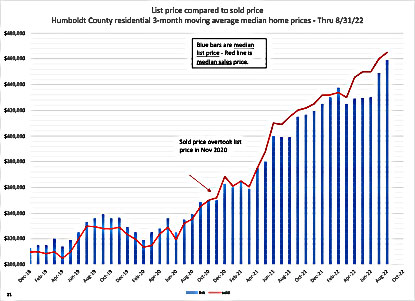
11. – List price compared to sold price. We are still seeing median selling prices above median listing prices. Overbids are still ongoing although the gap closed somewhat in July and closed even more in August. This is a lessening of buying pressure. It’s a market in transition.
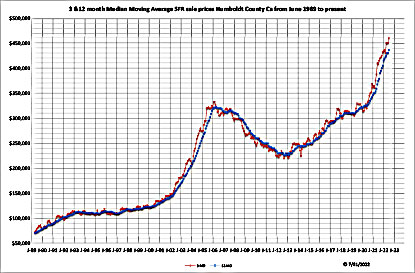
Bonus Chart for August – 2c – Median Price 3 & 12 month MA long term. This chart goes back to mid 1989 when the MLS went digital and shows the 3 and 12 month median moving average of sales price for the past 33 years. I thought you might want to see where we’ve come from. Prices are not adjusted for inflation.