Continue reading for updated trends in the Real Estate Market for Humboldt County.
Let’s start with some math. For a conventional loan, we’re looking at an 8% interest rate, this means $733 per month per $100,000 borrowed per month.. At a 3% interest rate it was $420 per $100,000 borrowed per month. Property taxes are ~ $116 per $100,000 purchased, per month.
Insurance is all over the map, let’s just call it $100 per month total (if you’re in a high fire zone like Willow Creek, Kneeland, Greenwood Heights, Jacoby Creek, etc it is likely higher).
This totals ~$850 per month per $100,000 borrowed, at 8% interest, plus insurance (and utilities, maintenance, landscape, improvements, new coffee maker, etc)
Financing a home has become expensive.
My big takeaways from this month’s charts—We’re not seeing as many homes listed for sale as I expected, although this time of year things tend to slow down.
This is likely due to so many refinances in the last 3 years…Why sell and lose your excellent interest rate, if you don’t have to.
I am also surprised we’re seeing new listings sold in under 20 days.. This means we have an active market of buyers.
The total # of homes sold continues to drop, I expect this will continue with high interest rates.
My thoughts- It is cheaper to rent than buy. This should cause more buyers to rent, creating a demand and rental prices to rise.
If we start to see more homes listed, it will give buyers more options and likely bring home prices down.
Coming into an election year, high interest rates and posturing on the global stage of potential war, there is uncertainty on the horizon.
Looking forward to December statistics!
-Dane
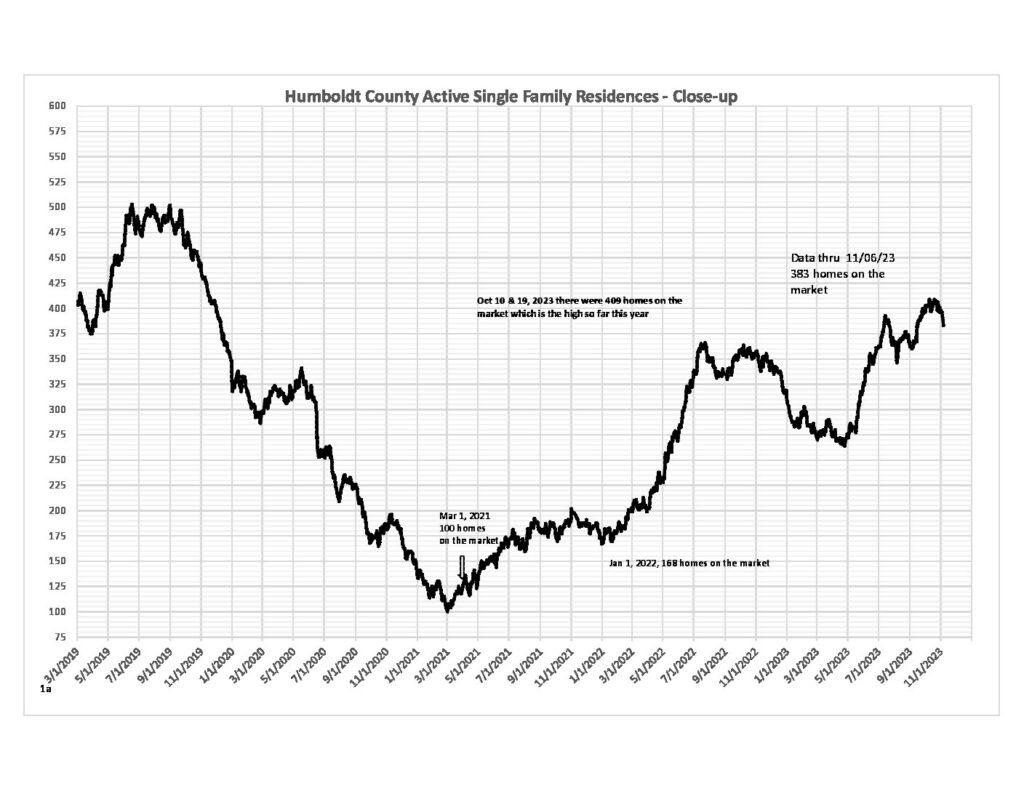
1. Active residences (current inventory) – The number of homes on the market continued to rise into October and hit a high for the year of 409 homes on the market on Oct 10th and 19th. Hopefully, these higher numbers have provided additional options for those buyers who have been patiently waiting for “their” home to come on the market. We now have begun to turn down from those highs and the normal trend into the end of the year is for lower numbers of active listings. I would not expect the number to fall to the lows of last year, though.
2. Median prices. The upward movement in the 3-month median price stalled in August at a price of $445,000 remaining the same as that of July. I mentioned last month that “The market appears to have hit a bit of a headwind.” Well that headwind caused the September 3-month median price to decrease to $435,000 and drop below the 12-month median price. When that happened in November of last ye ar, prices continued to fall for a couple more months. We are still facing that headwind and the market may be signaling a drift lower in price into the end of the year.
3. Median DOM (days on market -the time period where 50% of the homes leave the market for homes that sold over the past 30 days.) We continue to see normal seasonal market behavior as “days on market” continue to climb as we end the selling season. The previous 30-day period was 15-21 DOM, the most current 30-day period is 19-28 DOM. This doesn’t move very fast but I expect to see the 30-day range climb as we move toward and into the winter months.
4. Number of pendings last 30 days close-up. There was a bit of a burst of energy in home buying for the month of October. We hit a low on October 1 of 77 pendings for a 30-day period but the range for the next 35 days was 77 to 99. The number of pendings stalled at 99 for the month and bounced up and down throughout the month. It is not unusual to get an end of the buying season burst but if we are back in a normal, annual cycle (after the pandemic and very low interest rates), I expect to see lower numbers moving into winter. Based on the previous years, we are heading to our January low before the numbers begin to climb again.
5. Homes sold for 12 Consecutive Months. Last month I wrote, “The number of homes sold for a 12-month period leveled out for two months (June had 1012 and July had 1013). But it was short-lived because August dropped through the 1000 mark to sit now at 989.” Our descent in the number of homes sold for a 12-month period was again slowed with September’s number coming in at 989, the same as August. With our pendings continuing to decrease, I don’t think we have hit bottom yet, though, in annualized sales numbers.
6. List price compared to sold price. Last month I wrote, “If the headwind that has come against the 3-month median sales price continues, we may see the list price decrease also. Sellers will not be able to hold out indefinitely.” October saw not only a continued decrease in median sales prices but a $10,000 decrease in the median list price from $449,000 to $439,000. It appears that sellers are needing to adjust their expectations in order to encourage buyers to make an offer. If interest rates continue on the streak they are on, we will most likely see more of this trend in the coming months.
Click able chart to view Market Statistics 6 page pdf